Edmunds EV Charging Test: How fast does each EV charge?

We test EVs to find out which ones charge the quickest

Dash

Latest Highlights

  • Edmunds EV Charging Test provides you fast-charging times required to add range to a vehicle's battery
  • This independent evaluation of fast-charging speeds counters different automakers' charging speed data
  • Hyundai Ioniq 6 Limited RWD tops the list with an impressive 868 miles per charging hour
  • The Chevrolet Bolt EUV shows its age, charging at a leisurely 172 miles per charging hour

What's On This Page?

  1. The Leaderboard: Fastest-charging EVs ranked
  2. The Table: Get an in-depth look at our charging test data
  3. FAQs: Learn how Edmunds does this test, why we test, and more

Charging an electric vehicle isn't the same as filling up a gas tank. It does take longer to recharge an EV battery and charging times differ considerably from vehicle to vehicle. Historically, there has been no industry standard for measuring charging speeds — auto manufacturers have been able to pick and choose charging data to highlight the best attributes of their vehicles without scrutiny. The Edmunds EV Charging Test establishes a new standard, based on real-world testing and empirical data. It's the first independent measure of how quickly a car can add range to its battery at a fast charger.

Put simply, it's a measure of how long you'll be stopped to refill on a family road trip. We describe this as the average miles per charging hour, and to provide some additional context, we also quote the average time it takes to add 100 miles of charge. We hope you find it useful.

Edmunds EV Charging Test

The definitive guide to fast-charging speeds

Edmunds tested miles per charging hour
#12
2023 Kia EV6 GT
568 mi/hr
#49
2022 Chevrolet Bolt
179 mi/hr
with P3

Updated May 20, 2024

Edmunds logo
Vehicle
Edmunds tested charging losses
2024 Hyundai Ioniq 6 Limited RWD (single motor)926 mi/hr06 min 29 sec24.2 kWh/100 mina242 kW224 kW9.9%
2025 Porsche Taycan Performance Battery Plus821 mi/hr07 min 18 sec30.8 kWh/100 mi320 kW303 kW253 kW10.7%
2024 Hyundai Ioniq 6 Limited AWD (dual motor)815 mi/hr07 min 22 sec27.5 kWh/100 mina242 kW224 kW9.9%
2025 Porsche Taycan 4S Performance Battery Plus771 mi/hr07 min 47 sec32.8 kWh/100 mi320 kW303 kW253 kW10.7%
2022 Kia EV6 Wind rwd (single motor)727 mi/hr08 min 15 sec26.0 kWh/100 mi240 kW236 kW189 kW9.1%
2024 Porsche Macan 4 Electric (EVgo)716 mi/hr08 min 23 sec29.2 kWh/100 mi270 kW285 kW209 kW8.4%
2023 Genesis GV60 Performance696 mi/hr08 min 37 sec30.9 kWh/100 mina241 kW215 kW9.3%
2022 Hyundai Ioniq 5 dual motor696 mi/hr08 min 37 sec30.9 kWh/100 mina241 kW215 kW9.3%
2020 Porsche Taycan 4S663 mi/hr09 min 3 sec32.3 kWh/100 mi270 kW270 kW214 kW9.0%
2023 Genesis Electrified GV70 AWD Prestige652 mi/hr09 min 13 sec33.0 kWh/100 mina241 kW215 kW9.3%
2022 Kia EV6 GT Line (second car)641 mi/hr09 min 22 sec29.5 kWh/100 mi240 kW236 kW189 kW9.1%
2023 Genesis Electrified G80641 mi/hr9 min 22 sec30.6 kWh/100 mina192 kW196 kW10.2%
2022 Mercedes-Benz EQS 450+627 mi/hr9 min 34 sec29.5 kWh/100 mi200 kW211 kW185 kW9.6%
2025 Porsche Macan Turbo624 mi/hr9 min 37 sec33.5 kWh/100 mi270 kW285 kW209 kW8.4%
2024 Kia EV9 GT-Line AWD (dual motor)580 mi/hr10 min 21 sec35.7 kWh/100 mi215 kW221 kW207 kW12.7%
2022 Mercedes-Benz EQS 580 4matic561 mi/hr10 min 42 sec33.0 kWh/100 mi200 kW211 kW185 kW9.6%
2022 Porsche Taycan GTS560 mi/hr10 min 43 sec38.2 kWh/100 mi270 kW270 kW214 kW9.0%
2023 Mercedes-Benz EQE SUV 350+548 mi/hr10 min 57 sec30.3 kWh/100 mi170 kW179 kW166 kW11.3%
2021 Porsche Taycan 4S Cross Turismo (21 inch wheels)546 mi/hr10 min 59 sec39.2 kWh/100 mi270 kW270 kW214 kW9.0%
2023 Kia EV6 GT537 mi/hr11 min 10 sec35.2 kWh/100 mi240 kW236 kW189 kW9.1%
2023 Merecedes-Benz EQS SUV 450+525 mi/hr11 min 26 sec35.3 kWh/100 mi200 kW211 kW185 kW9.6%
2023 Mercedes-Benz EQE 350 4Matic482 mi/hr12 min 26 sec34.4 kWh/100 mi170 kW179 kW166 kW11.3%
2022 Mercedes-Benz AMG EQS 53 4matic478 mi/hr12 min 33 sec38.7 kWh/100 mi200 kW211 kW185 kW9.6%
2022 Lucid Air Grand Touring (long term) 19-in wheels468 mi/hr12 min 49 sec28.4 kWh/100 mi300 kW270 kW133 kW11.5%
2023 Tesla Model 3 Long Range456 mi/hr13 min 9 sec23.9 kWh/100 mi250 kW251 kW109 kW0.9%
2021 Tesla Model S Plaid442 mi/hr13 min 34 sec32.1 kWh/100 mi250 kW251 kW142 kW0.7%
2024 BMW i5 eDrive40439 mi/hr13 min 41 sec28.7 kWh/100 mi205 kW214 kW126 kW5.8%
2023 Mercedes-Benz AMG EQE437 mi/hr13 min 44 sec38.0 kWh/100 mi170 kW179 kW166 kW11.3%
2022 BMW iX xDrive50 (22-in wheels)432 mi/hr13 min 54 sec32.0 kWh/100 mi195 kW196 kW138 kW11.0%
2021 Tesla Model Y Long Range (20-inch wheels)431 mi/hr13 min 55 sec26.2 kWh/100 mi250 kW229 kW113 kW0.9%
2024 Tesla Model 3 Long Range Dual Motor431 mi/hr13 min 56 sec25.3 kWh/100 mi250 kW219 kW109 kW14.6%
2025 Audi Q4 55 e-tron409 mi/hr14 min 41 sec32.3 kWh/100 mi175 kW189 kW132 kW10.0%
2026 Tesla Model Y Long Range Launch Series (EA)403 mi/hr14 min 53 sec26.8 kWh/100 mi250 kW196 kW108 kW11.2%
2025 Volvo EX90397 mi/hr15 min 7 sec38.8 kWh/100 mi250 kW201 kW154 kW11.1%
2024 Volvo XC40 Recharge390 mi/hr15 min 24 sec29.0 kWh/100 mi200 kW211 kW113 kW8.0%
2020 Tesla Model Y Performance382 mi/hr15 min 43 sec29.6 kWh/100 mi250 kW229 kW113 kW0.9%
2023 Fisker Ocean Extreme One (22-in wheels)382 mi/hr15 min 43 sec35.4 kWh/100 mi250 kW177 kW135 kW4.9%
2023 BMW iX M60 (22-in wheels)369 mi/hr16 min 14 sec37.4 kWh/100 mi195 kW196 kW138 kW11.0%
2022 BMW i4 eDrive40 Gran Coupe (19-in wheels)366 mi/hr16 min 25 sec29.3 kWh/100 mi200 kW210 kW107 kW5.3%
2022 Audi RS e-tron GT363 mi/hr16 min 33 sec36.4 kWh/100 mi270 kW270 kW132 kW9.0%
2024 BMW i5 M60 (21-in wheels)360 mi/hr16 min 40 sec35.0 kWh/100 mi205 kW214 kW126 kW5.8%
2022 Audi e-tron GT355 mi/hr16 min 55 sec37.2 kWh/100 mi270 kW270 kW132 kW9.0%
2025 Volvo EX30 Twin Performance (19-in wheels)353 mi/hr16 min 59 sec28.6 kWh/100 mi153 kW147 kW101 kW7.2%
2021 Volkswagen ID.4 Pro352 mi/hr17 min 3 sec29.3 kWh/100 mi170 kW173 kW103 kW2.6%
2023 BMW i7 xDrive60 (21-in wheels)346 mi/hr17 min 19 sec35.5 kWh/100 mi195 kW207 kW123 kW3.6%
2024 Rivian R1T Performance Dual Motor Max (21-in. wheels)334 mi/hr17 min 59 sec42.3 kWh/100 mi215 kW215 kW141 kW4.2%
2024 BMW i7 M70 (21-in wheels)333 mi/hr18 min 0 sec36.9 kWh/100 mi195 kW207 kW123 kW3.6%
2025 BMW i4 eDrive40333 mi/hr18 min 0 sec32.1 kWh/100 mi200 kW210 kW107 kW5.3%
2022 Polestar 2 long range single motor329 mi/hr18 min 15 sec30.1 kWh/100 mi205 kW160 kW99 kW17.7%
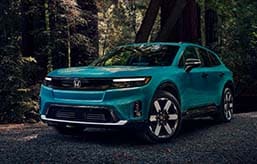
2024 Honda Prologue AWD Elite328 mi/hr18 min 16 sec31.1 kWh/100 mi150 kW163 kW102 kW10.2%
2023 Volkswagen ID.4 Pro S dual motor328 mi/hr18 min 17 sec31.4 kWh/100 mi170 kW173 kW103 kW2.6%
2024 Chevrolet Blazer EV RS AWD328 mi/hr18 min 19 sec31.1 kWh/100 mi150 kW163 kW102 kW14.1%
2022 Ford F-150 Lightning XLT (LT)316 mi/hr19 min 0 sec43.7 kWh/100 mi150 kW175 kW138 kW5.6%
2024 Rivian R1T Performance Dual Motor Max (22-in. wheels)314 mi/hr19 min 6 sec44.9 kWh/100 mi215 kW215 kW141 kW4.2%
2022 BMW i4 M50 (20-in wheels)314 mi/hr19 min 7 sec34.1 kWh/100 mi200 kW210 kW107 kW5.3%
2023 Polestar 2 long range dual motor311 mi/hr19 min 16 sec31.8 kWh/100 mi205 kW160 kW99 kW17.7%
2021 Ford Mustang Mach-E CA Route 1304 mi/hr19 min 42 sec28.9 kWh/100 mi150 kW163 kW88 kW1.0%
2022 Ford F-150 Lightning Platinum304 mi/hr19 min 44 sec45.4 kWh/100 mi150 kW175 kW138 kW5.6%
2021 Ford Mustang Mach-E Premium Ext Range RWD (LT)301 mi/hr19 min 55 sec29.2 kWh/100 mi150 kW163 kW88 kW1.0%
2024 Tesla Cybertruck Foundation Series (AT tires)293 mi/hr20 min 29 sec42.0 kWh/100 mi250 kW252 kW123 kW3.3%
2025 GMC Hummer EV SUV 3X Extreme Off-road284 mi/hr21 min 6 sec62.6 kWh/100 mi350 kW303 kW178 kW15.5%
2022 Rivian R1T Launch Edition AS tires281 mi/hr21 min 19 sec46.9 kWh/100 mi215 kW208 kW132 kW8.2%
2022 Rivian R1T Launch Edition (long term) AT tires281 mi/hr21 min 21 sec47.0 kWh/100 mi215 kW208 kW132 kW8.2%
2022 Rivian R1S Launch Edition AT tires279 mi/hr21 min 32 sec47.4 kWh/100 mi215 kW208 kW132 kW8.2%
2023 Ford Mustang Mach-E Premium AWD269 mi/hr22 min 17 sec32.7 kWh/100 mi150 kW163 kW88 kW1.0%
2025 Mini Cooper Countryman ALL4 SE267 mi/hr22 min 28 sec32.2 kWh/100 mi130 kW132 kW86 kW7.9%
2025 Hyundai Kona Limited267 mi/hr22 min 29 sec26.6 kWh/100 mi100 kW96 kW71 kW4.4%
2024 Ford Mustang Mach-E Rally248 mi/hr24 min 12 sec35.5 kWh/100 mi150 kW163 kW88 kW1.0%
2022 Ford Mustang Mach-E GT Performance235 mi/hr25 min 30 sec37.4 kWh/100 mi150 kW163 kW88 kW1.0%
2024 Dodge Charger EV Daytona Scat Pack184 mi/hr32 min 38 sec40.8 kWh/100 mi183 kW140 kW75 kW1.1%
2022 Chevrolet Bolt EUV Premier172 mi/hr34 min 50 sec26.7 kWh/100 mi54 kW54 kW46 kW1.7%

FAQs

What is fast charging?

Fast charging, sometimes called DC fast charging or Level 3 charging, is the quickest way to charge an EV. Fast-charging stations are typically available to the public and are operated by different companies such as Tesla, Electrify America and ChargePoint.

What does miles per charging hour mean?

Miles per charging hour means how many miles of range an EV can add in an hour of fast charging. A vehicle with a higher miles per charging hour tested figure will ultimately require less of your time spent waiting and charging compared to a vehicle with a lower miles per charging hour figure. Less time charging means more time driving!

How does Edmunds perform its EV charging test?

We teamed up with EV-testing specialists at P3 to get the most detailed charging data. P3 utilizes a device that monitors and records electricity use while an EV is connected to a fast-charging station as well as power request communication between the EV and the station. We then combine P3's data with Edmunds data on how much electricity a car uses per mile of driving to tell you actual miles per charging hour.

Why is Edmunds doing EV charging testing?

There is currently no universal charge time standard to which all manufacturers adhere. You may see one automaker claim its EV can use fast charging to charge from 10% to 80% in 35 minutes, while another touts that its EV can add 100 miles of range in just 20 minutes. It's nearly impossible to compare these different automaker claims and understand which vehicles are actually the best. Similar to the Edmunds EV Range Test, Edmunds EV Charging Test data gives EV shoppers unbiased charging information that they can use to make an informed decision.

Why is knowing an EV's miles per charging hour rate important?

Knowing how quickly a car can charge its battery is important, but so is knowing how efficiently an EV uses the energy in its battery. Miles per charging hour is a calculation that factors in how quickly an EV can charge along with how efficiently it can recharge.

How is miles per charging hour calculated?

The calculation for miles per charging hour is carried out by dividing the average charging power (in kilowatts) by the Edmunds tested consumption figure (kilowatt-hours used for every hundred miles traveled, or kWh/100 miles) and then multiplying the result by 100 to arrive at our mi/hr units. Again it is a measure used to gauge the charging efficiency of electric vehicles, providing insights on how many miles an EV can potentially cover per hour of charging.

What is the Edmunds EV Range Test?

The Edmunds EV Range Test is a real-world EV charging test. It is an apples-to-apples test that makes it easy to compare how quickly different electric vehicles can charge and gain range while connected to a fast-charging station.

What is Edmunds tested consumption?

After we complete the Edmunds EV Range Test on a vehicle and arrive back at our offices with the battery nearly empty, it's charged back to full capacity. The kilowatt-hours used from plug-in to a full charge are tracked. Then, we calculate the consumption based on the miles traveled. This process takes into account any charging losses in the Edmunds tested consumption number.

What is peak charging power?

Peak electric vehicle charging power refers to the maximum rate at which an electric vehicle can accept charge from a charging station. For our purposes here, we are referring specifically to DC fast-charging peak power and not Level 2 AC charging. Charging power is expressed in kilowatts (kW) and is determined by the capabilities of the vehicle's battery management system and the external charging station. The higher the peak charging power, the faster an EV can potentially recharge its battery, improving its convenience and practicality for longer trips or quick top-ups.

So is a high peak charging power always better?

Sort of. It's important to note that peak power values say nothing about how long vehicles sustain those levels. Some vehicles hit their peaks briefly and then drop off at a pretty steady rate, while others are able to maintain a higher power level over a longer period. Peak power rates are also usually realized when an EV's battery is significantly depleted and a vehicle's battery system has been primed to accept power at a high rate.

How do Edmunds and P3 measure peak charging power?

Edmunds and P3 measure peak charging power within the charging window of a vehicle beginning at 10% state of charge up to 80% state of charge. Peak is simply the max value we see at any point during this process.

How do Edmunds and P3 measure average charging power?

Similar to measuring peak charging power, Edmunds and P3 measure average charging power within the charging window of a vehicle beginning at 10% state of charge up to 80% state of charge. The difference here is we look at power from start to finish of the session and take the average value of everything.

Why do Edmunds and P3 test average charging power from 10% to 80%?

Beginning at a low 10% battery charge allows a vehicle's battery pack enough capacity to accept a large flow of energy. By stopping at 80% state of charge, you spare a battery's overall lifespan and better maintain its long-term performance. Charging power for most, if not all, vehicles also significantly slows beyond 80%, so it's often best to unplug at that point and free up that charging station for the next person.

What are charging losses?

Charging losses in an electric vehicle refer to the energy that is lost during the charging process, which can be caused by a variety of factors such as heat generation, efficiency of the charging equipment, and the car's battery management system. An easy way to grasp this in non-EV terms is if you're at a gas station and you're using a leaky gas pump. As you pump fuel into your vehicle, some of it spills out from the pump and lands on the ground, never making it into your gas tank. Depending on how bad the leak is, it may take you a little longer to fill up, not to mention you're paying for all the fuel that isn't making it into your tank.

How does Edmunds measure charging losses?

Edmunds measures charging losses based on the amount of energy used to charge a vehicle from 10% to 80% and compares that figure to what would equal 70% (80% minus 10%) of the total net capacity (the usable battery capacity) of a vehicle. For example, if your battery has a total net capacity of 100 kWh, it should take only 71 kWh to charge it from 10% to 80% (there are 71 increments between 10 and 80). If we measure that it took 80 kWh to charge the battery from 10% to 80%, then charging losses would equal 11.3%.


Get More Edmunds Car News in Your Inbox